Recorded campaign results
Production data. Not projections.
Two enterprise programs, fixed cohorts, real dates. Where this page shows an example instead, it says so.
Postcards dispatched
One telecom program · 18 states · Apr–Aug 2026
Print acceptance
60,259 uploaded · 86 rejected
USPS-confirmed delivered
50,254 pieces · May 27–Jul 22, 2026
Unique email open rate
Mobile carrier · 10,969 recipients · benchmark 35.6%
Recorded · direct mail at enterprise scale
An enterprise telecom provider, 18 states, every new business the day it files.
90,000+ personalized 6×9 postcards over monthly waves, April to August 2026. Each piece carries a QR code that belongs to one specific business owner. Individual-level attribution on every card.
A · Print processing
All portal-deployed waves, Apr–Aug 2026 · of 60,259 uploaded
B · Delivery
Five completed waves, May 27–Jul 22, 2026 · of 50,254 pieces with final USPS scans
Print processing counts every portal-deployed wave (60,259 uploaded). Delivery is measured only on the five completed waves, May 27 to July 22, 2026 (50,254 pieces; recent waves still in transit are excluded), so the two groups have different denominators. A delivered postcard is not a lead; scans and replies are counted separately. The USPS national benchmark is 96.8% delivered within standard +3 days (Postal Regulatory Commission, Jul 2026). We hit parity on the structurally hardest mail segment: brand-new addresses, which USPS adds at about 6,015 delivery points per day (USPS Postal Facts, FY2025).
QR scans, each attributed
53 business owners · same program
58 scans. 53 business owners.
Not "we got 58 clicks." Every scan resolves to a specific business owner who held the card in their hands, with their industry, location, timestamp, and device. A few scanned twice, which the dashboard also knows. Sales follows up on people, not percentages.
Owners' names stay in the client's dashboard. What a scan record looks like is shown below, with synthetic data.
Recorded · email at first touch
A national mobile carrier, in the inbox on filing day.
Unique open rate
4,341 of 10,969 recipients · 7 campaigns · as of Aug 7, 2026
A 4-touch personalized sequence across 7 campaigns. 39.6% of recipients opened, above Mailchimp's 35.63% benchmark for opt-in lists (Mailchimp, campaigns with 1,000+ subscribers).
These aren't newsletters people subscribed to. They're first-touch emails to business owners on the day they filed, sent to deliverability-screened addresses. The timing is the product.
Open rates industry-wide are inflated by Apple Mail Privacy Protection; the benchmark and our figure share that inflation.
Example campaign · synthetic business, copy and chronology
What it looks like for one business.
Marisol Quintero registers Quintero's Corner Kitchen in Sarasota on a Monday. By the afternoon she's reading a personalized email. Tuesday, a postcard with her business name is printed. Thursday it's on her counter, and Friday at 10:42 AM she scans the QR code. Saturday morning she replies: “Can you call me today? We open on the 28th and I haven't picked a card reader yet.”
Typical filing-to-first-contact in this industry runs 6 to 16 weeks once data compilation, list delivery, and campaign production each take their share. In this example, six days from filing to a conversation.
Mon 9:04 AM
Filed
Registered with the Secretary of State.
Mon 2:17 PM
Email #1 delivered
Personalized, from your domain, in your name.
Tue
Postcard printed
Her name, her business, her own QR code.
Thu
Delivered
USPS scan confirms it reached the mailbox.
Fri 10:42 AM
QR scanned
From her phone. Attributed to her, not a campaign total.
Sat 9:12 AM
Reply · Interested
Classified automatically, surfaced to your team.
Sat 9:14 AM
Lead details copied
Your team follows up from your own inbox.
Blue events are digital, navy are physical mail, green is a person who wants to hear from you. The whole story, with the email and the postcard →
Product demonstration · real capabilities, synthetic data
What your team receives.
The replies view, as it works: classified replies, the conversation, and one button that copies the lead for your CRM. The data here is invented; the screens are real.
Interested reply Interested Sat 9:12 AM
Marisol Quintero Quintero's Corner Kitchen LLC · Sarasota, FL · filed Mon 9:04 AM
“Can you call me today? We open on the 28th and I haven't picked a card reader yet.”
Why she deserves a call
- Opened email #1 Monday afternoon
- Her postcard was delivered Thursday, USPS-scanned
- Scanned her QR code Friday 10:42 AM, then read your pricing page
- Replied Saturday morning; classified Interested automatically
What your team does next
Copies the owner, business, filing date, every touch and the reply as text, ready for your CRM. Then you reply from your own inbox. Nothing is sent from the portal, and it never replies as you.
The dashboard · anonymized production screenshot
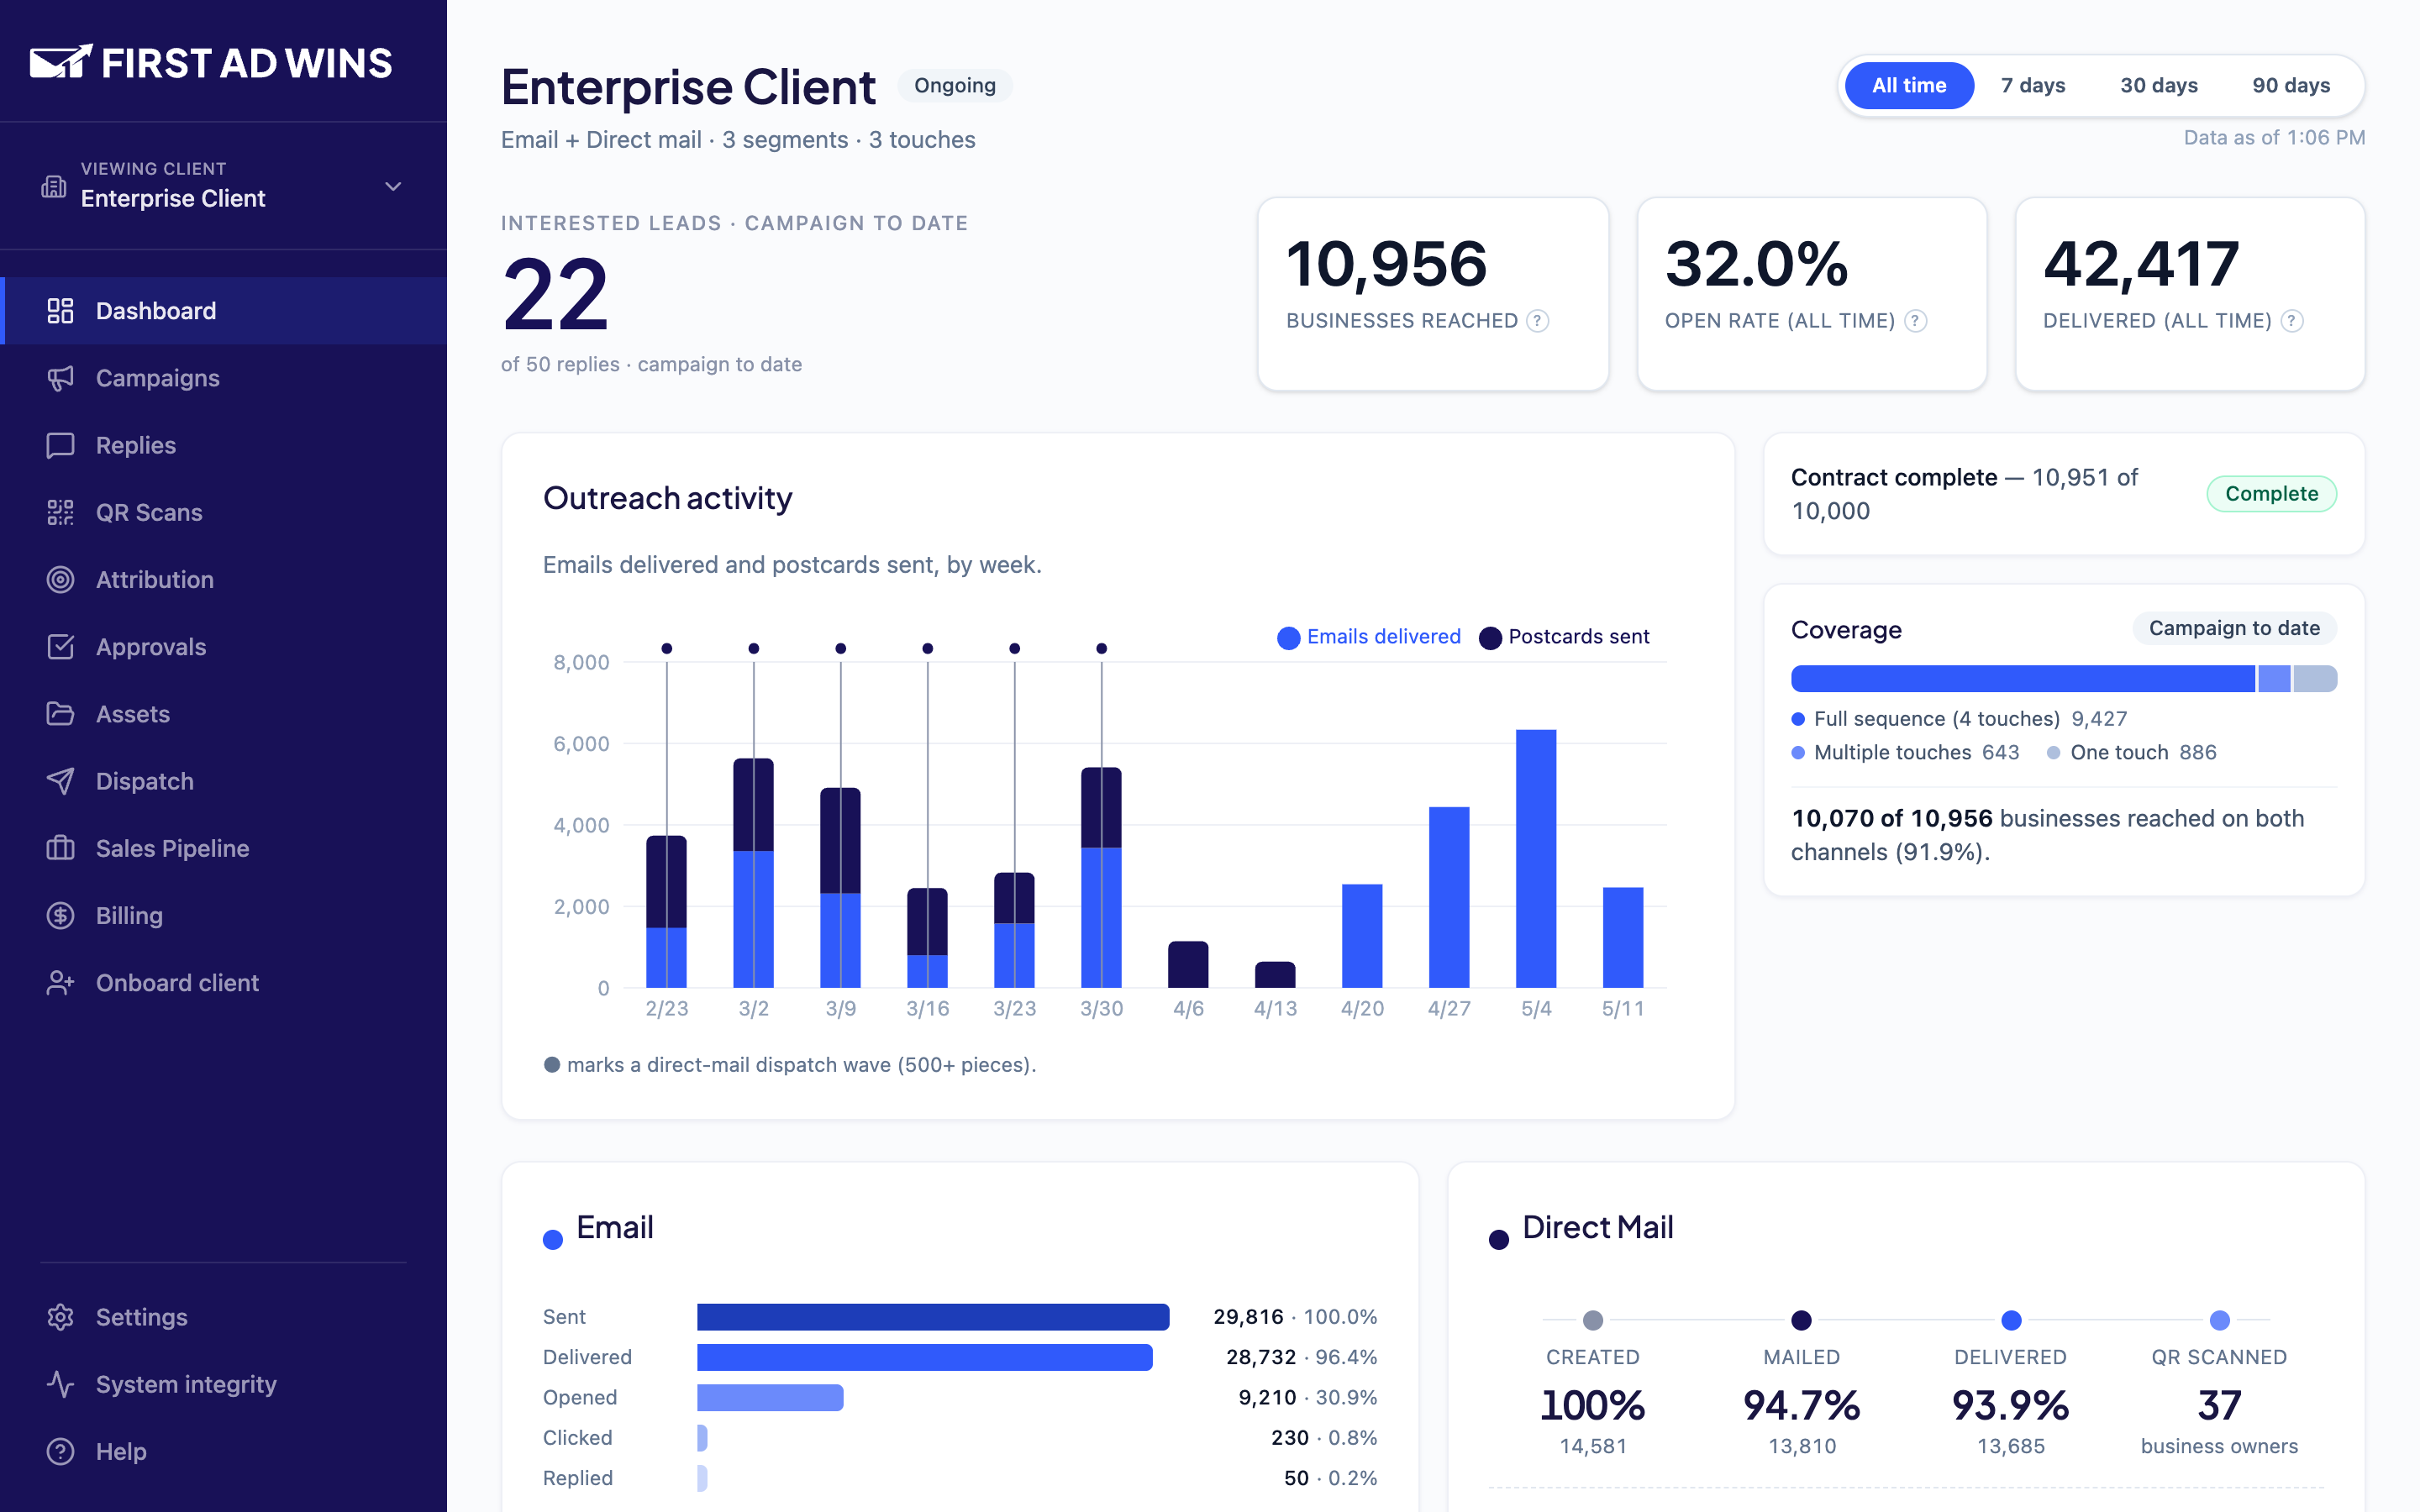
One enterprise client's dashboard with the client name removed. The numbers on it are theirs.
Recorded · every figure with its cohort and source
The numbers, with sources.
What it costs to run: per-business pricing →
Real numbers from real campaigns.
Yours would start accumulating in week one.
We'll count your market on the call. Real counts, real pricing. No pitch deck.